Introduction (to Internship)
During the 2018 Fall semester, I applied for the CUNY 2X Spring Residency program with the hope of interning at an innovative company. This opportunity presented itself when I was matched with Numina. During my first two days with the engineering team, I learned about their unique technology stack and took part in a meeting where the engineers brainstormed a short list of 18 novel projects suitable for interns. These projects varied in complexity and encompassed things such as front-end development, data analysis, and computer vision. The project that stood out to me involved detecting sensor movement and anomalous events in the Numina sensor’s field of view using computer vision. Having an automated system to perform these tasks would prove useful for the engineers who currently had to perform these checks manually.
Background & Problem
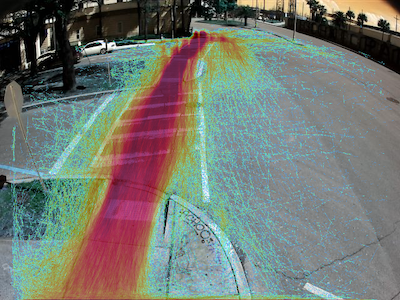
Numina sensors are camera-based devices which use imagery of streets to measure activity automatically and anonymously, using advanced computer vision algorithms purpose-built for street environments. The sensors output only anonymous object information—no images and no personally identifiable information (PII), just path information as shown here:
At one point, a sensor shifted slightly from its original mounted location, significantly changing its field of view (FOV). The event went undetected, leading to days of incorrect data. Besides physical sensor movement, weather events like rain and fog, construction scaffolding, and large vehicles can all obstruct a sensor’s FOV. All of these situations lead to the loss of data for clients. With the help of the engineering team and the use of computer vision tools, like OpenCV, I embarked on my first project to track and quantify sensor movement and obstructions.
Methodology
The first step was to compare different feature detectors provided by OpenCV. Most of my tests involved SIFT and ORB, which are different algorithms used to find image “features” – basically unique groups of pixels within an image. Here are some visual examples of results detecting SIFT and ORB features in one of the sensor images.
SIFT features

ORB features

After features are identified in one sensor image, they can be matched with features found in a different image from the same sensor. To test feature matching between two images, I tested several image processing techniques including converting to grayscale, blurring images with different sized kernels, extracting edges, and sharpening. These pre-processing techniques can be used to normalize pixel data and sharpen or blur certain features, which led to significant increases in feature matching accuracy. Overall, I found that using a Gaussian blur led to the biggest improvement for feature matching in my test cases.
Here are two examples of feature matching between a daytime and a nighttime image. In the first example, with Gaussian blur applied, features detected in the top image are spread out throughout the image. In the bottom image, where Gaussian blur and grayscale is applied, features detection are concentrated to a corner of the curb.

Deploying to AWS
We used feature matches to derive metrics based on feature match characteristics. These metrics allowed us to identify anomaly events, such as sensor movement or obstruction, as they occurred. To deploy the anomaly detection pipeline into production, we integrated the various feature matching algorithms and metric calculation into Numina’s AWS infrastructure. I converted the code into a set of functions that could be deployed to AWS Lambda using the Serverless framework. Then, I configured the anomaly detection function to run whenever new image files were added to AWS S3. The Lambda function reads images from S3, finds feature matches, and computes the “feature shift” and “total matches” metric; the metrics are sent to AWS CloudWatch for future tracking. These metrics allowed us to identify anomaly events, such as sensor movement or obstruction, as they occurred.
Detecting Sensor Movement
Now that we have feature matches across images, we can derive metrics based on feature match characteristics to represent different sensor movement or obstruction events. For example, the “feature shift” metric, which represents movement of features in relation to the sensor FOV, provides a valuable alert for possible sensor movement. Metrics on “feature shift” from one sensor changed drastically when the light pole the sensor was attached to was dented and damaged after a vehicular collision. The chart below shows “feature shift” over time, where expected behavior is to have a cycle of short peaks and long troughs. On 04/25, however, when the light pole was struck, we see a long stretch of high “feature shift” values.

Another instance of sensor movement, indicated by the “feature shift” metric, can be seen in the following images taken from a fallen indoor sensor. The pixel shift values shown here quantify this movement and are reported via AWS CloudWatch.

Detecting Sensor Downtime
A valuable metric was the total number of feature matches. If the “total matches” metric was zero, for example, we could identify events where the sensor had gone offline altogether. We configured CloudWatch to alert us when such events were detected.
Detecting Weather Obstructions
I was also able to apply this concept to look at physical obstructions in the sensor FOV. Leveraging “total matches” detection showed a significant decrease in the number of matches when water droplets were present on the sensor FOV.
Future Work
Our use of AWS tools like S3, Lambda, and Cloudwatch will allow us to implement other useful features such as automated alerting. By specifying conditions for each metric, Cloudwatch alerts can not only log, but also proactively notify the team when the sensor has moved, been blocked, or is otherwise behaving abnormally. Additional image characteristics can be incorporated into logs and alerts as well, such as the saturation and brightness levels, which could indicate an issue with image quality.
The infrastructure we built for this project provides a solid foundation for image feature extraction and metric calculation to identify the status of camera-based sensors. These capabilities are especially useful in Numina’s case, because our sensors perform edge processing, sending numerical sensor data, rather than continuous images to our backend. This project allows us to uphold our mission of ‘intelligence without surveillance’ and automate our ability to detect anomalous image characteristics. For me, this was a valuable opportunity to learn about important computer vision concepts like image pre-processing and feature matching. I enjoyed applying these concepts to an interesting real-world use case. My internship at Numina sparked a personal interest in computer vision, and I look forward to exploring it further in my future work.