
Numina’s mission is to empower cities with data to become more responsive, so they are safer, healthier, and more equitable for the people who live in them. Our platform provides vital real-time, ground-level intelligence — without surveillance — to help urban planners and municipal governments design better streets and public places.
Questions of accuracy, reliability, and privacy are among the key considerations to keep in mind when evaluating real-world applications of computer vision.
While computer vision is being applied in a wide range of industries, standards for evaluating data accuracy and reliability range widely. Many systems may claim “>99% accuracy,” but for any system that is providing more complex data than a binary status like “hotdog” or “not hotdog,” what does this accuracy number really mean?
Unlike other methods of data collection, such as manual observation or mechanical devices, the way computer vision algorithms work may not be as intuitive or straightforward to explain, even if they can produce better results. Thus, a conversation about accuracy of computer vision systems should include clear explanations of methodology as well as error types and their implications, in order to build understanding and trust. This blog post accompanies a more detailed document on Numina’s approach to applying computer vision for street-level data collection, evaluating data quality, and validating and improving our algorithms.
To collect data, a Numina sensor uses a camera and an attached processor running machine learning algorithms. One Numina sensor can cover a radius of 125 feet (38 meters), approximately the size of an intersection, half-block segment, or mid-sized plaza. Our computer vision system follows a similar logical flow to how humans gather data on moving objects in a street: detect individual objects in the line of sight, categorize their type (e.g. pedestrian, bicycle, etc.), and track their movements throughout the scene. Unlike humans, computer vision systems can simultaneously keep track of all objects within the camera’s field of view, without needing to focus on specific objects, and can continuously function without loss of energy or performance. They also immediately digitize this information in formats that other machines or software can ingest in near real time. And they can be designed, as Numina is, to do so in a way that immediately anonymizes data and actually protects privacy in a more automated and secure way than even a human observing a place might. Computer vision does, however, face other challenges in detecting and tracking objects.
Numina Computer Vision System
Our system has three main tasks, which are described and illustrated below. To illustrate different technical concepts in this document, we’ve used a stock photo of an urban landscape. While intersections like the one pictured are typical of Numina deployments, this particular image is not a standard representation of a Numina sensor view.
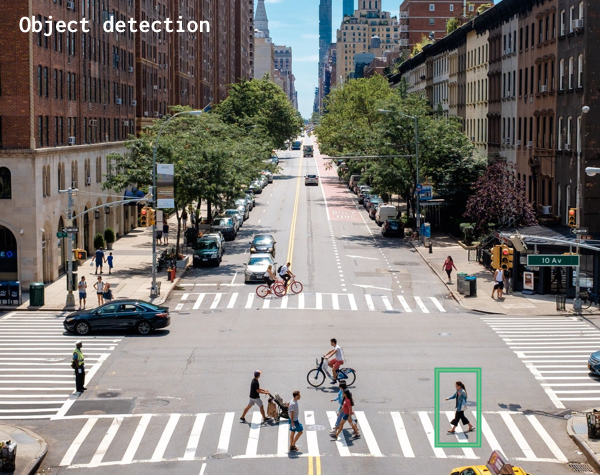
I. Object Detection
The first task is to detect that some object is present within the scene, regardless of what it is. To do so, the algorithm locates where an object is within an image . This location can be represented in different ways, such as a point or a border. For Numina systems, the object location is denoted with a rectangular box.
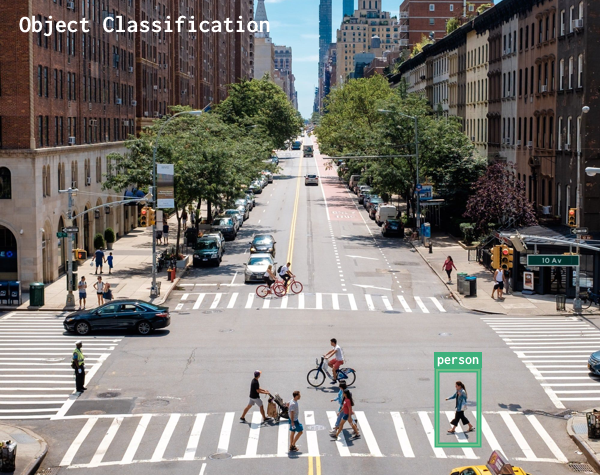
II. Object Classification
After the object and its location are identified, the next step is to classify or categorize what the object is. The ability to detect specific objects is predicated on the computer vision algorithm’s “learning,” or seeing many examples of that object. Accordingly, big datasets, with a diverse range of representations of different object, are crucial to the performance of a model. The model’s ability to “see” and “understand” an object’s location and type is dependent on it having learned on prior examples like it. Currently, the objects that Numina’s computer vision algorithms detect include: person, bicycle, bus, truck, car, trash bag, and dog, and we are continually working to train our algorithms to detect new objects.
III. Object Tracking
The final step is to track a specific object’s movement across the scene. That is, Numina detects the path of the object detected. Doing so requires detecting the same object in consecutive images and “connecting the dots” between images to form a complete path. Tracking is important because it allows our system to capture important information on an object’s path, or its “desire line,” and collect volume count data for different object types by time and space.
In order to successfully track an object, the algorithm must be able to correctly detect and classify it over consecutive images and match these multiple occurrences to the same object and path. This task becomes significantly more difficult when there are multiple objects in the scene, moving at the same time. To learn more about our approach to addressing the biggest technical challenges, please refer to our article on multi-object tracking.
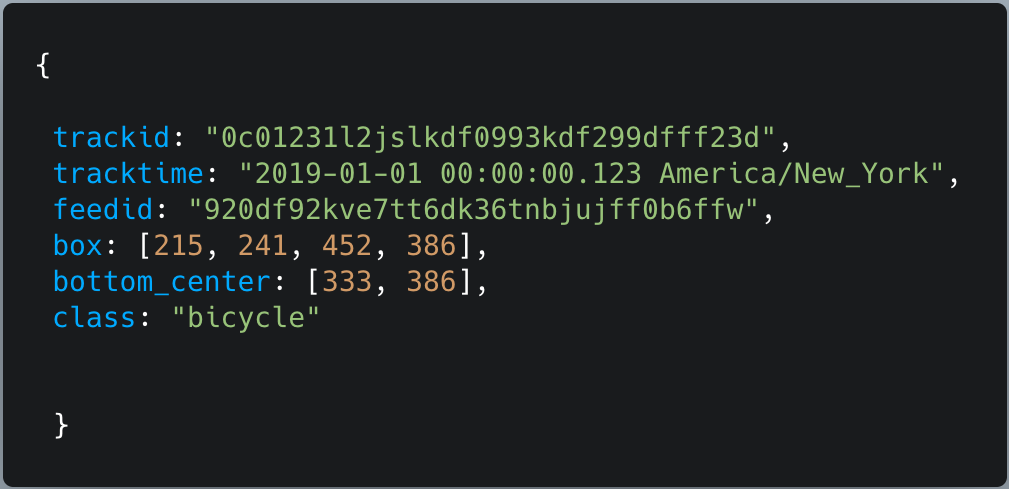
Numina’s raw movement data, obtained from the sensor’s detection, classification, and tracking, is structured as a detection and location of a type of object at a specific data. This data snippet illustrates the data we do collect (object type and location, timestamp) as well as the data we do not collect (images, videos, or any other Personally Identifiable Information). This data is then translated into our metrics and insights such as object counts, path visualization, and activity heat maps. To learn more about our techniques for collecting street-level data with a privacy-first approach, please refer to our privacy policy.
To evaluate the accuracy of Numina systems, it’s important to understand the various error types that can occur in each of the three steps of our computer vision system. The errors have a waterfall effect, such that if an object isn’t detected, then it will not be classified or tracked. Thus, object detection is the first gate for accurate data, and multiple correct detections are essential for successful tracking. For these reasons, Numina accuracy evaluation places an emphasis on assessing object detection because of its direct impact on errors for the other steps in the process. While errors are concerning in any dataset, one important note is that while causes of human error may be unique to each particular human, errors produced by specific algorithms can be more predictable, quantifiable, and thus, straightforward to address. This section includes descriptions and visualizations of each error type, as well as important factors and implications to consider with each.
I. Detection Errors
Click to expand images.
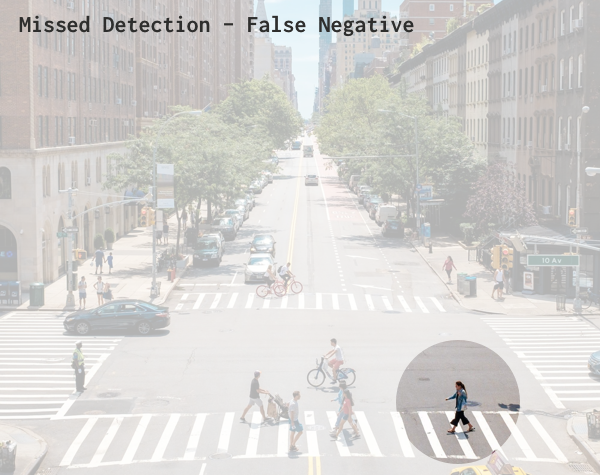
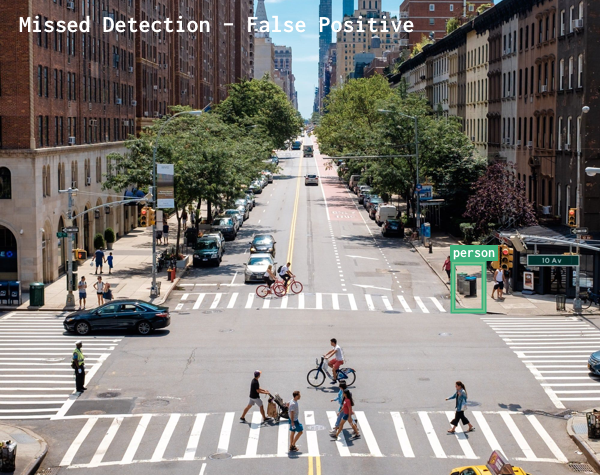

A. Missed Detection – False Negative Error
A Missed Detection (or False Negative) error occurs when an object is present in the scene, but the algorithm doesn’t detect it, thus it is missing from the data. Weather, lighting, and other obstructions like crowds can affect detectability. This kind of error causes our object counts to be lower than the actuality.
B. Over-Detection – False Positive Error
A False Positive error occurs when the algorithm detects an object that is not in the scene. This kind of error causes our object counts to be higher than the actuality.
C. Location Error
A Location (or Localization) error occurs when an object and its location in the scene are identified, but the box is placed in the wrong place. The detection box may be much larger than the object, potentially capturing other objects and background in the box, or it may be much smaller than the object, cutting out key components of the object. For example, if a box only includes the trunk of a car for a detection of a car. This kind of error does not affect object counts, but it can affect path visualizations and zone analysis.
II. Classification Errors
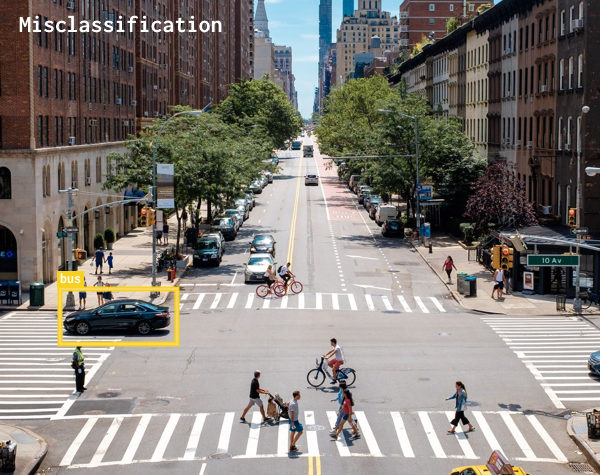
A. Misclassification error
The Misclassification error occurs when an object in the scene is correctly detected and localized, but it’s classified as the wrong object type. For example, in a rare case, if a detected person is classified as a bicycle, or in a more common case, when a faraway bus is detected as a truck. This error can affect any metric grouped by object type, which encompasses the majority of our data.
III. Tracking Errors
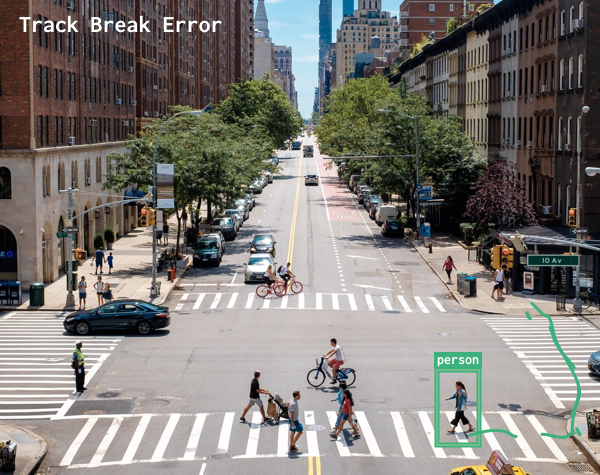
A. Track Break Error
An object is correctly detected and classified at multiple points over time, but at some points, we miss connecting all the occurrences of an object in the images to the same track. This kind of error can cause counts of a single object to be recorded as multiple objects, increasing the object counts.
Data Validation
Given the complexity of Numina’s processes for collecting raw data and data metrics, our measures of accuracy are more complex than assigning a binary “correct” or “incorrect” to each datapoint. The weight we give to different errors varies based on the implications of the error (e.g. drawing a smaller box around the object location is a less problemsome error than not detecting the object in the first place). Our team measures and maintains a range of accuracy indicators for object detection, classification, and tracking including:
Detection
- True Positive Counts: number of objects correctly detected and classified
- False Positive Counts: number of objects detected when there was no object
- False Negative Counts: number of objects not detected when there was an object
- Precision: how often the algorithm is correct when an object is detected
- Recall: how often an object is detected, when it is present in the scene
Classification
- Misclassification Count: number of objects detected correctly, but classified incorrectly
Tracking
- Track Break Rate: the average number of times one track breaks into multiple segments
- Manual Count comparison: how manual counts compare to Numina counts
Other considerations in data quality are related to external variables such as the weather and lighting at a sensor location, physical obstructions to the sensor view, and fluctuations in power and cellular network availability to the sensor. While these environmental and infrastructure challenges are rare, the difference in these factors across different deployments can cause a variation in data accuracy and reliability. Some real examples of these challenges include a spiderweb obstructing the lens of a sensor, dark images at a site with little ambient lighting, and sensor outages when the electricity in the area went out.
To reach our goal of helping users understand and trust the data, we will share these metrics for each deployment in regular updates. In the future, we hope also to provide our current statistics for these metrics on our website.
Future Work
Numina’s engineering team is continually working to validate our data, identify occurrences of different errors, and improve our algorithms to address its current weaknesses. By retraining our computer vision systems with a subset of data from each Numina site, our algorithms are learning how to adapt to the distinct data at each street, plaza, and park we work with. Beyond improving the computer vision systems, we are developing a range of hardware and software solutions to collect and calculate the best data. A list of our ongoing technical improvement efforts include:
- Retraining computer vision algorithms to improve object detection and classification
- Improving object tracking with higher image frame rates
- Improving methods for matching simultaneous detections to multiple object tracks
In addition to advancing the technology, we are continually reviewing and updating our validation methods and communication techniques for explaining our system’s strengths and weaknesses. We believe that the value of data is dependent on the ability of its users to understand how it was collected, what meaning it captures (and doesn’t capture), and how to use it to support and advance their work. To this end, we will continue to update our accuracy metrics, to promote transparency and openness for public understanding of our technology, the quality of our data, and its progress over time.
We created this post because we recognize the importance of a straightforward and accessible explanation of computer vision accuracy methodologies. While many companies may share high-level accuracy numbers, they often don’t share how they’ve defined or calculated their accuracy rates. This practice is problematic for those who are trying to do an honest assessment of computer vision technologies. Our hope is to pull back the curtain for newcomers, so as an industry, we can have more informed conversations and share a common language for advancing the technology. We’d love your feedback. Please comment below or send additional thoughts to conversation@numina.co.
This post and white paper were authored by Jennifer Ding with heavy input from the entire Numina Team. Thanks to all who contributed!