Hi there! This post is a developer annotation of a previous analysis published on the Numina blog. In this post, we’ll go through how a developer can use the Numina API to analyze detailed street-level data. If you’re interested in using the Numina API, please request access to our developer sandbox here.
In New York City, construction and scaffolding are familiar backdrops of daily life, from the drone of jackhammers as an early morning wake-up call to commute detours due to an unexpected sidewalk closure or delivery truck parked in a bike lane. With over 300 miles of scaffolding in the city, at scale, these street level changes present a safety concern for pedestrians and disrupt the flow of traffic across all modes (e.g. pedestrian, bicycle, car).
At Numina, we measure a wide range of indicators of mobility and quality of life on our streets, including traffic volume counts, pedestrian road crossing paths, and incidents of illegal activity such as cars driving in the bus lane. This year, we measured the impact of a month of construction and scaffolding at a section of the Fulton Mall in Downtown Brooklyn.
Annotation: Devices Query
Let’s start by getting some basic geographic information about the Numina sensors deployed for our organization. First, follow the instructions in the Getting Started documentation to authenticate with the Numina API. You will notice that the Numina API is a GraphQL API; if you’re unfamiliar or rusty with GraphQL, you can get caught up here.
You can get information about the sensors that your user has access to by issuing the devices query like so:
For this analysis we’ll focus on the device with alias dbp-4 and serialno NUM200B001S0004.
Query:
query {
  devices {
    edges {
      node {
        serialno
        name
        location {
          lat
          lon
        }
      }
    }
  }
}
Response:
{
  "data": {
    "devices": {
      "edges": [
        {
          "node": {
            "location": {
              "lat": 40.689115,
              "lon": -73.98137
            },
            "name": "DBP-2 - Fulton St & Flatbush Ave",
            "serialno": "NUM200B001S0002"
          }
        },
        {
          "node": {
            "location": {
              "lat": 40.689305,
              "lon": -73.981786
            },
            "name": "DBP-4 - Fulton St & Hanover Pl mid-block",
            "serialno": "NUM200B001S0004"
          }
        },
        ...
      ]
    }
  }
As a major shopping destination and at the heart of the City’s third largest Central Business District, Fulton Mall is a hotspot for commuters and shoppers, and sees high pedestrian and cyclist activity throughout the area. However, it also hosts several bus stops and receives a significant amount of truck and car activity.
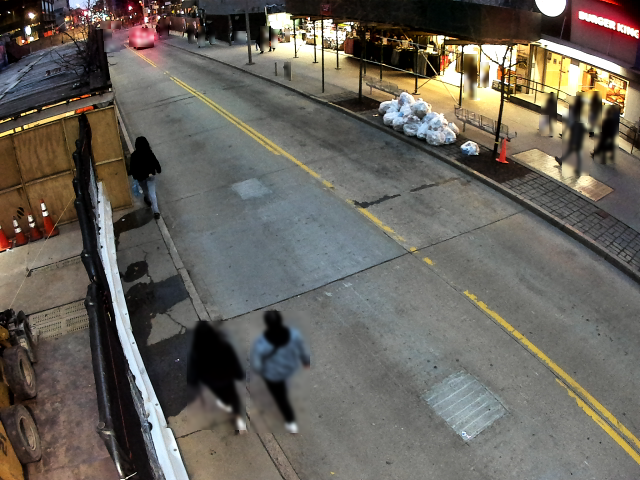
When we installed our sensors on Fulton Mall, with support from New Lab and Downtown Brooklyn Partnership, we noticed the prevalence of scaffolding in our image views, foreshadowing the high levels of construction in the area. A few weeks after, the first project, a building demolition, began, closing down an entire stretch of sidewalk, and on some days, even the road.
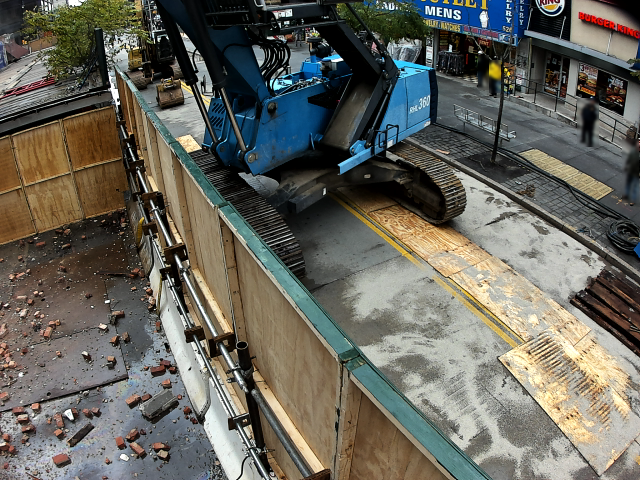
One of our sensor’s field of view at Fulton Mall. Note: Our sensors transmit sample images once per hour, at random times each hour; the images are then de-identified. See our privacy policy for more details.
Annotation: Sample Images Query
We can access sample images for a given sensor’s field of view over time using the getSampleImages query in the Numina API like so:
Query:
query { getSampleImages(serialno:"NUM200B001S0004", startDate:"2019-08-01", endDate:"2019-09-01") {
    edges {
      node {
        presignedUrl
        date
      }
    }
  }
}
Response:
{
  "data": {
    "getSampleImages": {
      "edges": [
        {
          "node": {
            "date": "2019-08-01",
            "presignedUrl": "https://numina-sample-images-test.s3.amazonaws.com/NUM200B001S0004/2019-08-01.png?AWSAccessKeyId=..."
          }
        },
        {
          "node": {
            "date": "2019-08-10",
            "presignedUrl": "https://numina-sample-images-test.s3.amazonaws.com/NUM200B001S0004/2019-08-10.png?AWSAccessKeyId=..."
          }
        }
      ]
    }
  }
}
Currently, users need to request for an updated sample image to be used starting on a given date. If you believe that your sensor view has changed significantly due to construction or changes to the built environment, please contact support@numina.co and we will facilitate adding a new timestamped sample image.
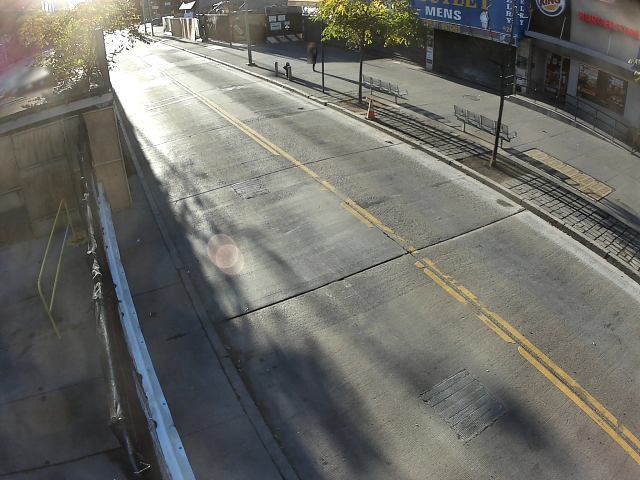
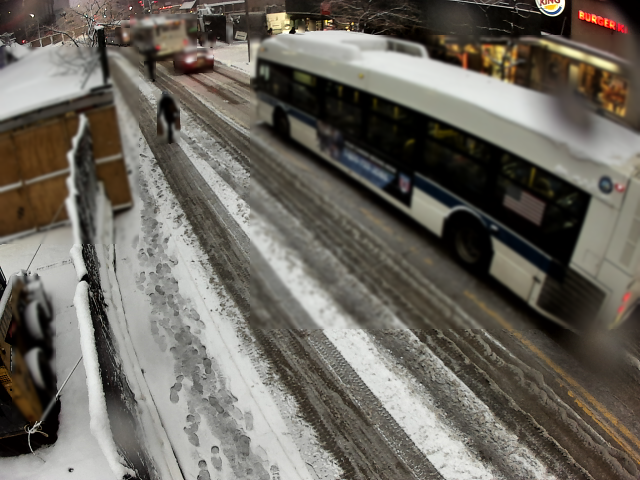
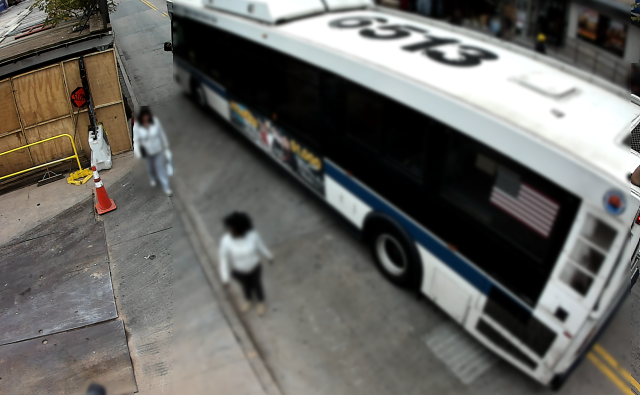
After a few days, the road was cleared, but only a small opening connected the sidewalk across either side of the construction site. This forced pedestrians to step into the road often and even walk in the road regularly. Seasons passed, and even during snowy days, pedestrians found themselves sharing the road with vehicles, often large trucks and buses.
Annotation: Create Behavior Zone Mutation
Let’s try to understand how pedestrian road crossings was affected by the presence of construction and scaffolding on Fulton Mall. First, we need to define “the road” as a spatial region of our image; the Numina API refers to these regions as Behavior Zones. The easiest way to create a Behavior Zone is via the sensor view in the Numina dashboard. However, if you are part of our Developer Sandbox you can use our in-browser Behavior Zone Creator.
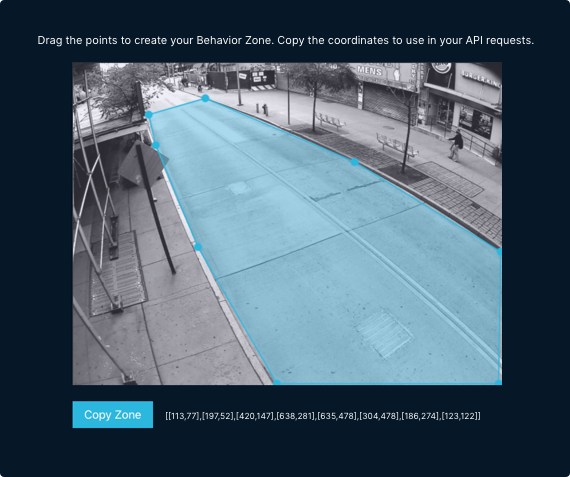
Grab the coordinates produced by the drawing tool and use the createBehaviorZone mutation like so:
Mutation:
mutation {
  createBehaviorZone(
    demarcation: [[106, 59], [159, 42], [269, 81], [415,147], [640, 277], [635,479], [302, 486], [130, 145], [130, 145]], serialno: "NUM200B001S0004", text: "Roadway"
  ) {
    behaviorZone {
      rawId
      demarcation
      text
    }
  }
}
Response:
{
  "data": {
    "behaviorZone": {
      "rawId": 1340,
      "demarcation": [[106, 59], [159, 42], [269, 81], [415,147], [640, 277], [635,479], [302, 486], [130, 145], [130, 145]],
      "text": "Roadway"
    }
  }
}
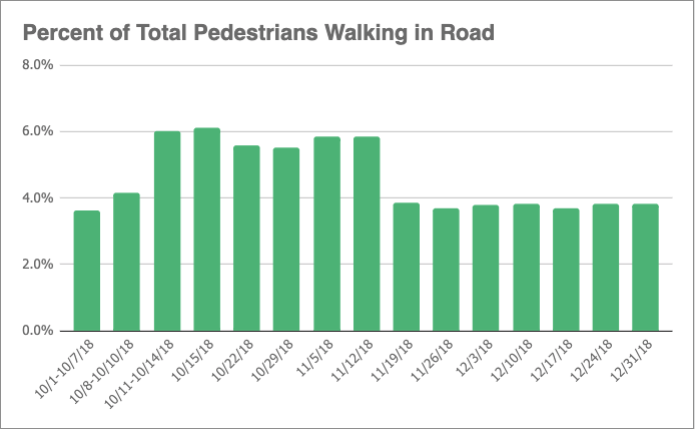
Over a month after construction began, the sidewalk was partially reopened, but the scaffolding remained, and pedestrians continued to walk in the street occasionally. We compared pedestrian activity during the construction period, 10/11/18 – 11/19/18, to that before and after construction. By applying spatial analysis techniques to our pedestrian movement data, we were able to analyze how many more pedestrians walked on the street when the sidewalk was obstructed by construction. The data showed that pedestrians were 53.3% more likely to walk in the road during that time frame.
Annotation: Using the CountMetrics analytics queries
To perform this analysis we need to use analytics queries in the Numina API. First, we will want to know how many pedestrians were detected by this sensor over the given time period. For this purpose, we can use the feedCountMetrics query by passing in our sensor’s serial number, a date range, a time interval, and a list of object classes. The feedCountMetrics query will return a response similar to the following:
Query:
query {
  feedCountMetrics(
    serialnos:["NUM200B001S0004"],
    startTime:"2018-10-15T00:00:00",
    endTime:"2018-10-18T00:00:00",
    objClasses:["pedestrian"],
    timezone:"America/New_York",
    interval:"1d") {
    edges {
      node {
        serialno
        result
        time
        objClass
      }
    }
  }
}
Response:
{
  "data": {
    "feedCountMetrics": {
     "edges": [
        {
          "node": {
            "objClass": "pedestrian",
            "result": 46840.0,
            "serialno": "NUM200B001S0004",
            "time": "2018-10-15T00:00:00-04:00"
          }
        },
        {
          "node": {
            "objClass": "pedestrian",
            "result": 52897.0,
            "serialno": "NUM200B001S0004",
            "time": "2018-10-16T00:00:00-04:00"
          }
        },
        {
          "node": {
            "objClass": "pedestrian",
            "result": 47592.0,
            "serialno": "NUM200B001S0004",
            "time": "2018-10-17T00:00:00-04:00"
          }
        }
      ]
    }
  }
}
Then, we can issue another zoneCountMetrics query to the Numina API, passing the rawId of the “Roadway” Behavior Zone we created earlier with our mutation:
Query:
query {
  zoneCountMetrics(
    zoneIds:[1340],
    startTime:"2018-10-15T00:00:00",
    endTime:"2018-10-18T00:00:00",
    objClasses:["pedestrian"],
    timezone: "America/New_York",
    interval: "1d",
   ) {
     edges {
       node {
         objClass
         time
         result
      }
    }
  }
}
Response:
{
  "data": {
    "zoneCountMetrics": {
      "edges": [
        {
          "node": {
            "objClass": "pedestrian",
            "result": 2526.0,
            "time": "2018-10-15T00:00:00-04:00",
            "zoneIds": [
              1340
            ]
          }
        },
        {
          "node": {
            "objClass": "pedestrian",
            "result": 5167.0,
            "time": "2018-10-16T00:00:00-04:00",
            "zoneIds": [
              1340
            ]
          }
        },
        {
          "node": {
            "objClass": "pedestrian",
            "result": 3997.0,
            "time": "2018-10-17T00:00:00-04:00",
            "zoneIds": [
              1340
            ]
          }
        }
      ]
    }
  }
}
We can use the resulting counts data from the two analytics queries to compare the counts of pedestrians in the road versus total pedestrians. This normalizes the counts data and lets us understand how anomalous counts are for a given time period.
Some other troubling trends we observed occurred when delivery trucks parked on the side of the two-lane road, effectively shutting down a lane and transforming the street into a one lane road. With pedestrians, cyclists, and two directions of car, bus, and truck traffic sharing one lane, risk of collision between any of these modes increased significantly.
Annotation: Visualizing street-level activity with heatmaps
This specific animation was created with in-house software, but we can still generate data visualizations using the Numina API. To get an understanding of how pedestrians moved about this scene over a period of time, we can call the feedHeatmaps analytics query with our serialno:
Query:
query {
  feedHeatmaps(
    serialno: "NUM200B001S0004",
    startTime: "2018-10-15T00:00:00",
    endTime: "2018-10-22T00:00:00",
    objClasses: ["pedestrian"]
  ) {
    edges {
      node {
        objClass
        heatmap
      }
    }
  }
}
Response:
{
  "data": {
    "feedHeatmaps": {
      "edges": [
        {
          "node": {
            "heatmap": [
              [
                152,
                32,
                0.373
              ],
              [
                153,
                32,
                0.533
              ],
              [
                154,
                32,
                0.373
              ],
              ...
            ]
          }
        }
      ]
    }
  }
}
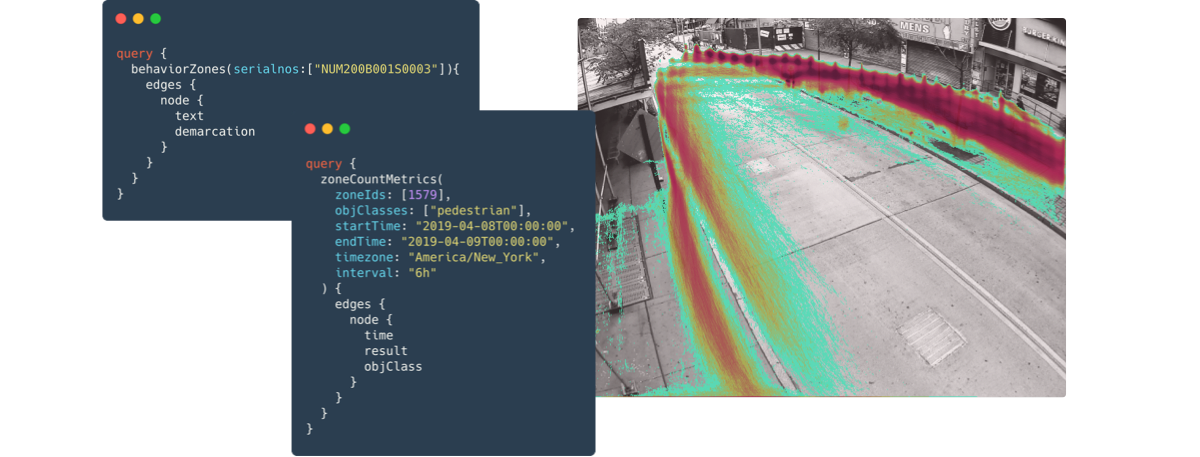
Note that the heatmap data is returned as a list of [x, y, data] objects. We can overlay this data on top of a sample image for the time period (retrieved in the Sample Images Query annotation) using a visualization library of our choice (such as opencv-python) to better understand pedestrian patterns in this streetscape:
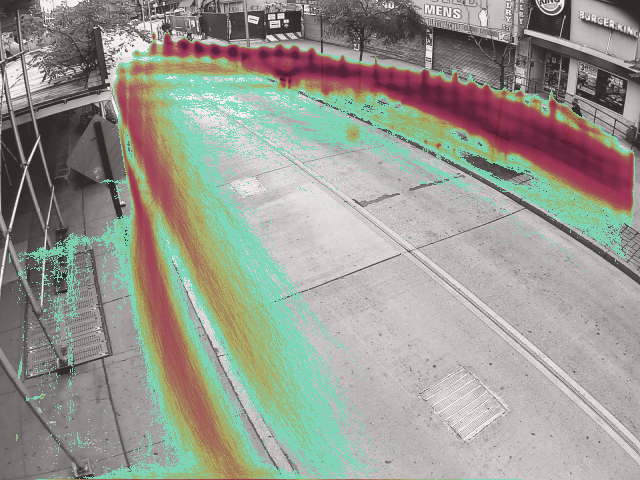
Similarly, we can also use the zoneHeatmap queries with our “Roadway” Behavior Zone from a few annotations above. This helps us hone in on the movement patterns of pedestrians who crossed the road:
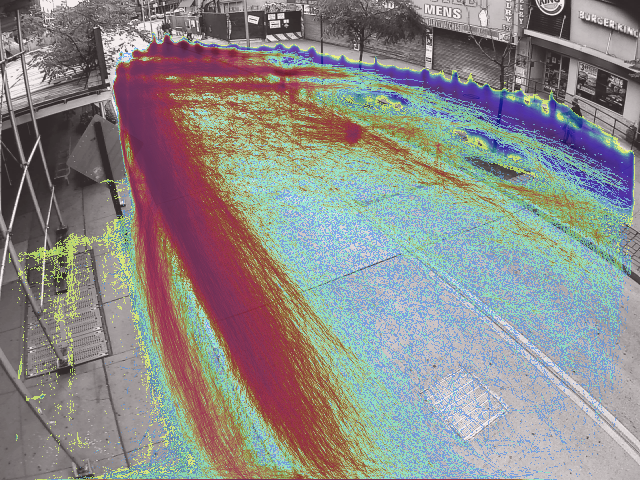
These visualizations (and our Behavior Zone filtering) are computed on the fly, over hundreds of thousands of objects. If you want to learn more about how we perform these computations quickly, see the talk we gave at Transit Techies NYC.
Two months after this construction project ended, another began at the end of the block, at the Fulton & Flatbush intersection, shutting down part of the sidewalk on the other side of the street. While building and street development is an inevitable part of New York City life, efforts can be made to improve safety conditions during these projects, such as better signage to inform pedestrians early on of a road closure, temporary pedestrian refuges or mid-block crosswalks at busy intersections, or better enforcement of idling vehicles during this period.
One of Numina’s goals is to provide responsible, secure, objective intelligence about the impact of street changes on everyone who uses our public realm, to identify opportunities for positive interventions improving safety, efficiency, and enjoyment of streets. Better understanding of construction’s impact on streets invites new ideas for temporary pedestrian infrastructure and ways to reimagine the streetscape during times of change.
How you can try the Numina API
We hope that this set of developer annotations serves as a helpful springboard on using the Numina API to dive into street-level data. We believe there’s plenty of work that could be done with the Numina API, such as anomaly detection, and analysis of weather and planned events. If you’re interested in using the Numina API to conduct data analyses of your own, please request access to our API Sandbox. The sandbox contains ten days of real street-level data from a sensor deployment in Downtown Brooklyn in New York City. Thanks for reading!